Task Efficiency Report
Written By Timothy Murenzi
Overview
The Task Efficiency Report compares estimated and actual time on tasks, so you can see where work runs over or under. Open it from Reports → Task Efficiency.
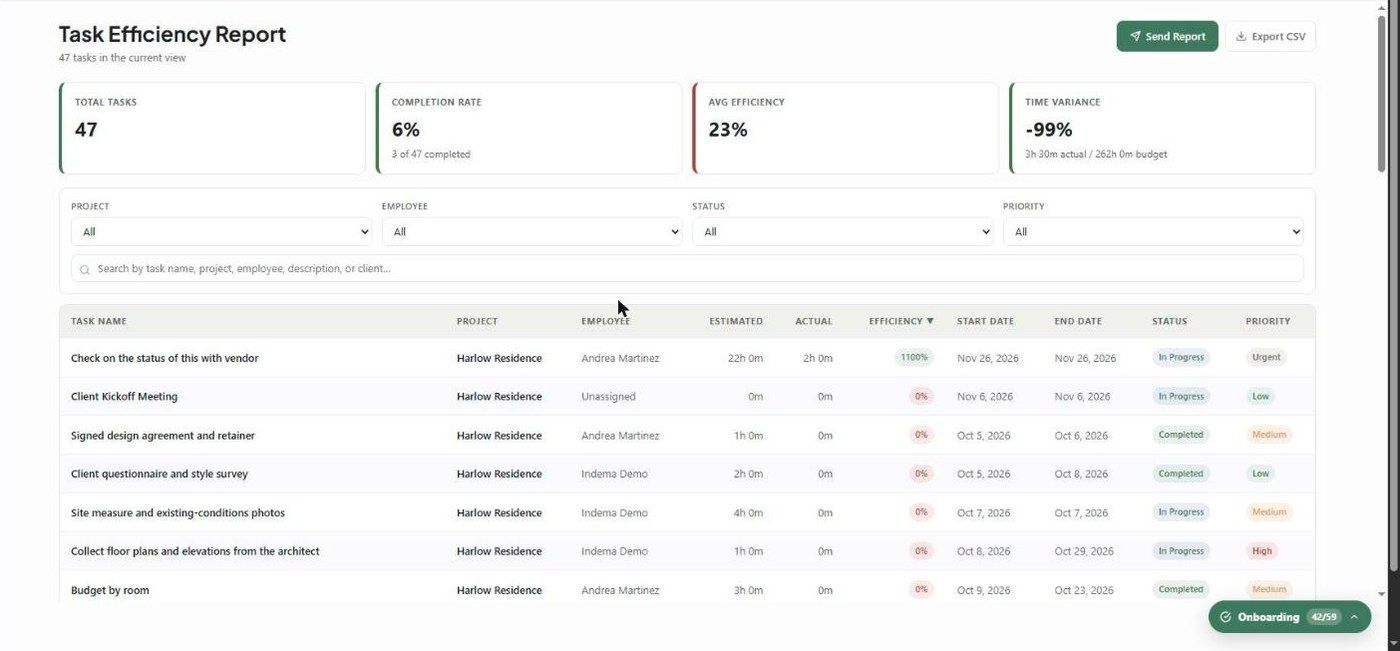
KPI cards
Total Tasks
Completion Rate — e.g. 3 of 47 completed
Avg Efficiency — estimated ÷ actual. Green at 100% or more, amber at 80% or more, red below.
Time Variance — (actual − estimate) ÷ estimate, with the totals
Table
Task Name, Project, Employee, Estimated, Actual, Efficiency, Start Date, End Date, Status and Priority. Every column sorts. The default is most efficient first.
Filters
Project, Employee, Status, Priority, and search by task, project, employee, description or client.
What to understand
Over 100% means the task took less time than estimated. Under 100% means it ran over.
Tasks with no logged time show 0%. A task needs both an estimate and logged time to be meaningful.
The employee shown is the task's first assignee.
Estimates come from each task's Hours field in Tasks, and actuals from timelogs on that task.
Related articles
Timelog Report
The Task panel (task details)
Was this helpful?
Still need help? Ask the team