Products Report
Written By Timothy Murenzi
Overview
The Products Report shows your FF&E items across projects, with cost, price and profit. Open it from Reports → Products Report.
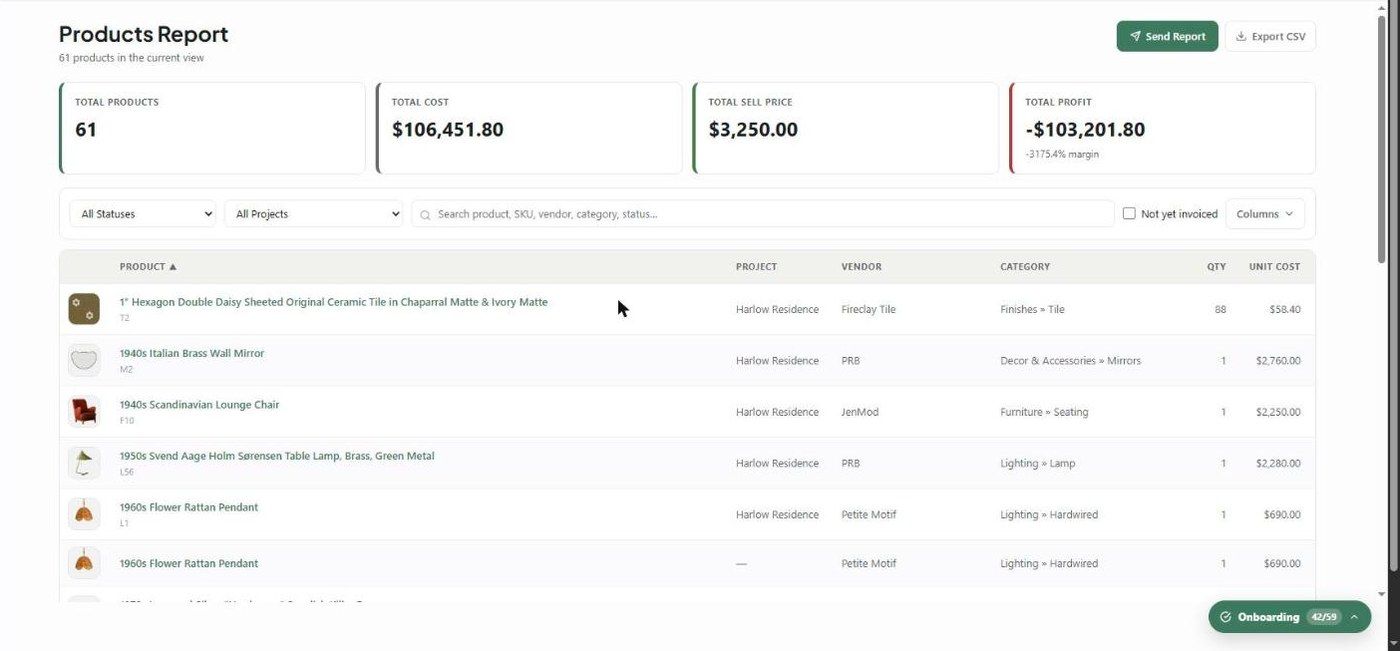
KPI cards
Total Products
Total Cost — quantity × unit cost
Total Sell Price — quantity × sell price
Total Profit — sell minus cost, with the overall margin
Columns
Thumbnail, Product (with spec #), Project, Vendor, Category, Qty, Unit Cost, Total Cost, Sell Price and Status. Use Columns to add Markup, Location and Date Added. Your choices are remembered.
Filters
Status and Project
Search by product, SKU, vendor, category or status
Not yet invoiced
Drill-down
Click a row to open the product: image, Total Cost / Total Sell / Profit with margin, full pricing, project, vendor, location and notes.
What to understand
If a product has no per-unit sell price, it's worked out from the client total ÷ quantity.
Markup = (sell − cost) ÷ cost.
Products with a cost but no client price (common at the Proposed stage) pull Total Profit down. Filter by status to see priced items only.
Related articles
Installation Report
Was this helpful?
Still need help? Ask the team