Profit & Loss Statement (preview — sample data)
Written By Timothy Murenzi
Preview — sample data. This report shows generated demo data and a banner saying so. Use it to preview the layout and send feedback, but don't rely on the numbers yet.
Where to find it
Reports → Financial Dashboard. It's also the page that opens when you click Reports.
What it shows
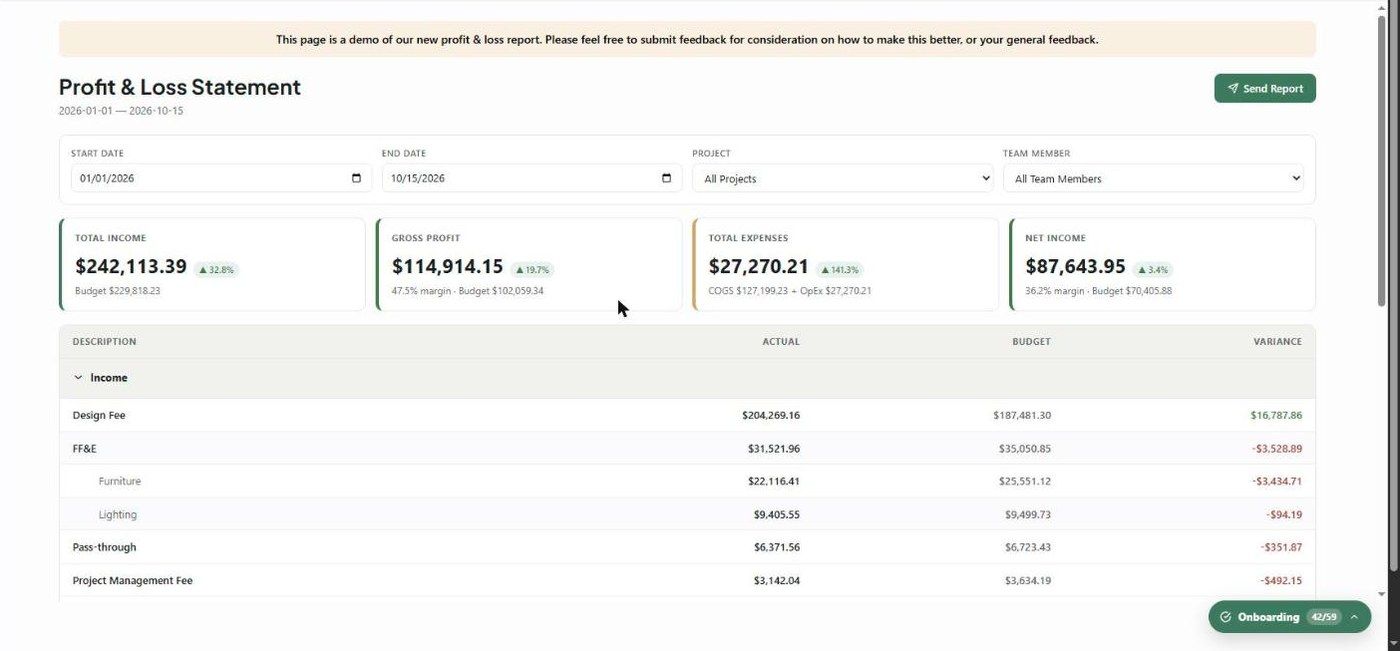
A full P&L as a collapsible statement: Income → Cost of Goods Sold → Gross Profit → Operating Expenses → Net Income, with Actual, Budget and Variance columns. Variance is green when favourable and red when not. Income breaks down by revenue stream (FF&E into sub-categories), and COGS by category.
KPI cards
Total Income, Gross Profit (with margin), Total Expenses and Net Income (with margin), each compared with the previous period.
Filters
Start and end date, Project and Team Member. Send Report emails a summary.
Real P&L numbers
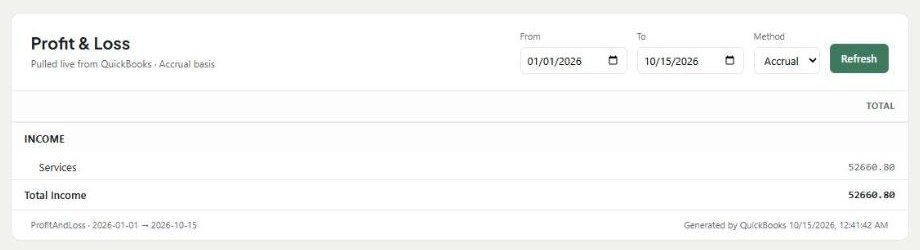
For a live Profit & Loss from your books, open Reports → QuickBooks P&L. It's pulled live from QuickBooks Online: choose From and To dates and the Method (Accrual or Cash), then click Refresh. QuickBooks must be connected (Settings → Studio → Integrations).
Was this helpful?
Still need help? Ask the team