Reports — Overview
Written By Timothy Murenzi
Overview
Reports turn your everyday work in Workroom — invoicing, purchasing, time tracking and product specs — into financial and operational insight. Every report reads live from your workspace, so there's nothing to enter twice.
Where to find them
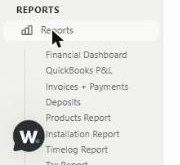
Click Reports under REPORTS in the left sidebar. The submenu lists each report:
Financial Dashboard
QuickBooks P&L
Invoices + Payments
Deposits
Products Report
Installation Report
Timelog Report
Tax Report
Task Efficiency
Purchase Order Report
Reports is a Pro feature. On LITE you'll see an upgrade prompt.
What every report shares
KPI cards across the top summarise the current, filtered view.
Filters and search narrow what you're looking at. KPIs and totals always reflect the filtered view, not your whole dataset.
Export CSV downloads exactly what's on screen, with your current filters and sort order.
Send Report emails the report from your studio's outbound address. Fill in To, CC, Subject and Message, then either Attach CSV or show the rows as a table in the email body (up to 1,000 rows).
Amounts use your studio currency.
Some reports remember your column choices and row density.
Previews
The Financial Dashboard (Profit & Loss Statement) opens when you click Reports. It shows sample data and a banner saying so — explore the layout and send feedback, but don't rely on the numbers yet. For real P&L figures, use QuickBooks P&L.
Scheduling reports
To send a set of reports automatically, go to Settings → Studio → Outbound email → Automated report sending and click Add schedule.
Related articles
Invoices & Payments Report
Timelog Report
QuickBooks Online Integration
Was this helpful?
Still need help? Ask the team