Timelog Report
Written By Timothy Murenzi
Overview
The Timelog Report shows your team's tracked time: utilisation, billable value, and what hasn't been invoiced yet. Open it from Reports → Timelog Report.
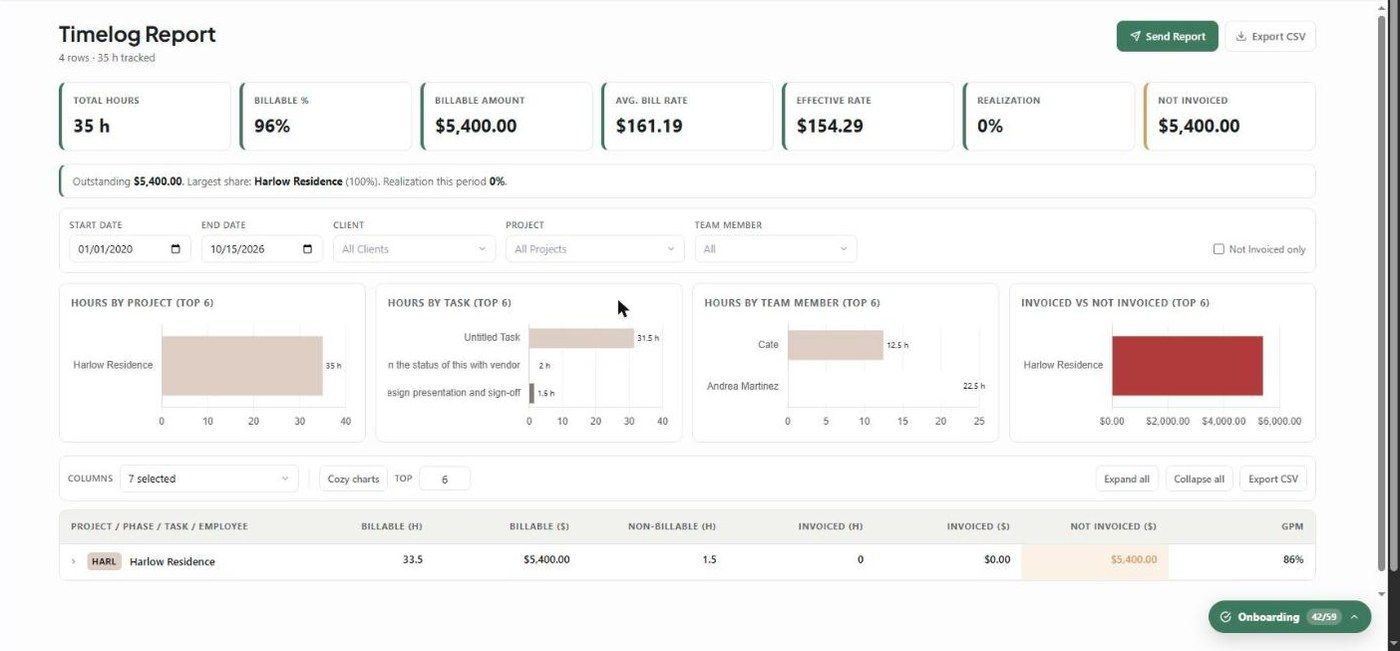
KPI cards
Total Hours — billable plus non-billable.
Billable % — billable hours ÷ total hours.
Billable Amount
Avg. Bill Rate — billable $ ÷ billable hours.
Effective Rate — invoiceable value ÷ total hours.
Realization — invoiced $ ÷ billable $.
Not Invoiced — billable dollars not yet invoiced.
A banner calls out what's outstanding and which project holds the largest share.
Charts
Hours by Project, by Task, by Team Member, and Invoiced vs Not Invoiced — the top 6 of each (change it with Top). Cozy charts changes the chart size.
Table
An expandable tree: Project → Phase → Task → Employee. Columns: Billable (h), Billable ($), Non-billable (h), Invoiced (h), Invoiced ($), Not invoiced ($), and GPM (labour gross profit margin). Use Expand all and Collapse all.
Filters
Start and end dates, Client, Project and Team Member, plus Not Invoiced only.
What to understand
Changing the dates re-fetches data from the server, so a wider range brings in more time.
GPM needs each person's cost rate (Settings → Studio → Team and rates). Without it, margin can't be calculated.
The CSV export is a roll-up with subtotal rows and a grand total.
Related articles
Task Efficiency Report
Service & Activity Types
Was this helpful?
Still need help? Ask the team